Key Points
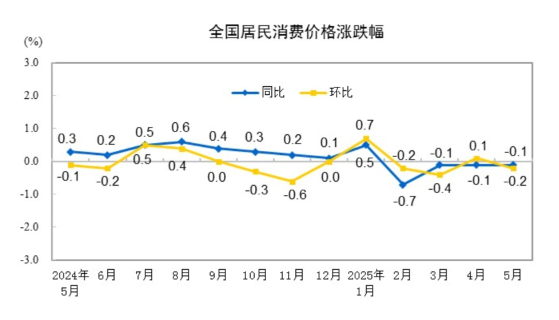
- CPI dipped slightly: 国家统计局 (National Bureau of Statistics) data shows China’s national Consumer Price Index (CPI) decreased by 0.1% year-on-year in May 2025, with a 0.2% month-on-month decrease.
- Core CPI showed resilience: While headline CPI dipped, the core CPI (excluding food and energy) saw its year-on-year increase slightly expand to 0.6%, suggesting some underlying consumer demand strength. Noteworthy increases included hotel accommodation (+4.6% MoM) and gold jewelry (+40.1% YoY).
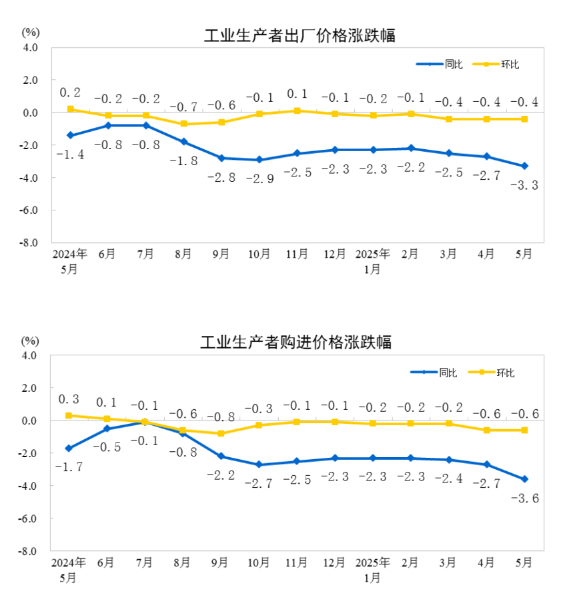
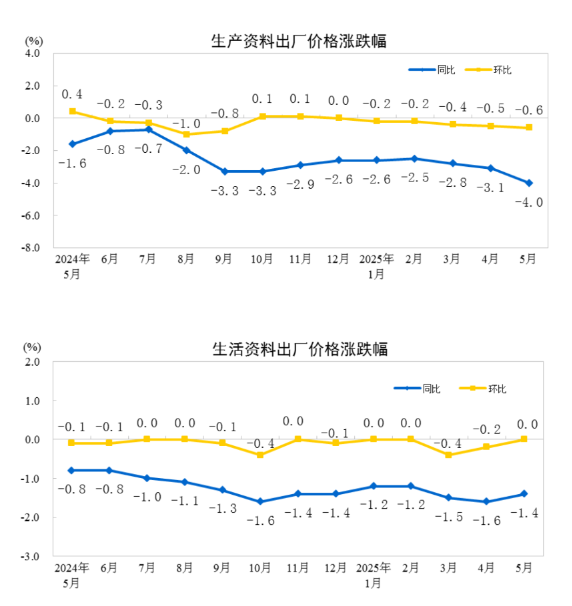
- PPI remains under pressure: The Producer Price Index (PPI) for industrial products fell by 3.3% year-on-year in May, continuing deflationary trends at the factory gate. Producer goods prices dropped significantly by 4.0% YoY.
- Sectoral divergence: Specific sectors like high-end equipment manufacturing and new energy industries (photovoltaics, lithium batteries) are showing signs of price stabilization or even increases, contrasting with declines in traditional industries like coal and construction materials.
Diving into the latest China economic data, May 2025 brought some interesting shifts in the country’s Consumer Price Index (CPI) and Producer Price Index (PPI), offering crucial signals for the global market.
Let’s break down what the National Bureau of Statistics numbers mean for you.
Decoding China’s May 2025 Consumer Price Index (CPI): A Slight Chill
In May 2025, China’s national Consumer Price Index (CPI) nudged down by 0.1% year-on-year (YoY).
Here’s the quick rundown:
- Urban areas: Prices held steady.
- Rural areas: A 0.4% decrease. (Insight: This urban-rural divergence could point to differing economic pressures or consumption patterns.)
- Food prices: Fell by 0.4%
- Non-food prices: No change.
- Consumer goods prices: Dropped by 0.5%.
- Service prices: Rose by 0.5%. (Insight: The resilience in service prices often indicates underlying consumer demand in certain sectors.)
Looking at the bigger picture, from January to May, the national CPI also saw a slight 0.1% decrease compared to the same period last year.
On a month-on-month (MoM) basis, the May CPI decreased by 0.2%.
- Both urban and rural areas saw a 0.2% dip.
- Food prices were down 0.2%.
- Non-food prices also fell 0.2%.
- Consumer goods prices decreased by 0.3%.
- Service prices remained stable.
CPI Deep Dive: What’s Hot and What’s Not (Year-on-Year)
Let’s get granular with the year-on-year changes in May:
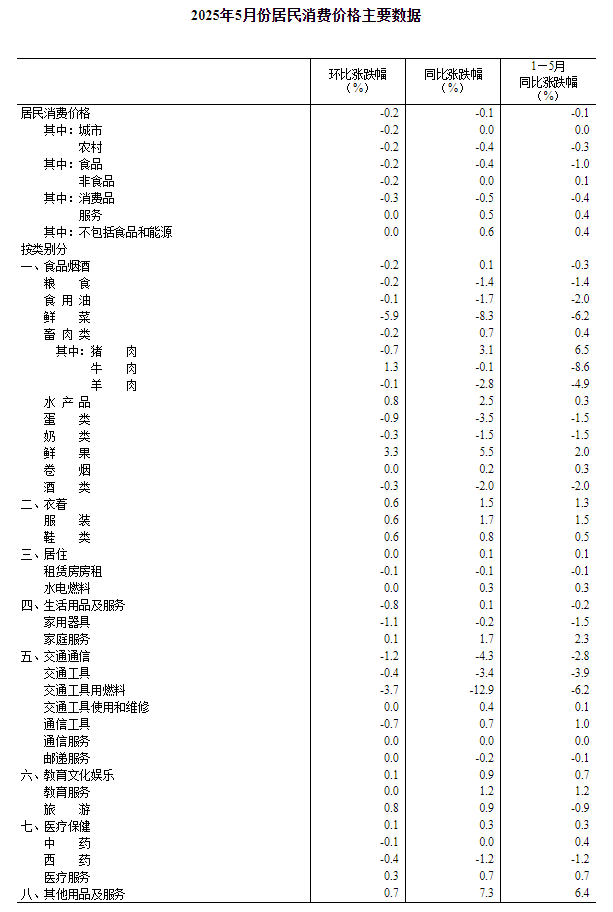
The Food, Tobacco, and Alcohol category saw a slight combined increase of 0.1% YoY, contributing a tiny 0.02 percentage points to the overall CPI rise.
Within food:
- Fresh Fruit: Big winner! Up 5.5% (adding 0.12 pp to CPI).
- Aquatic Products: Up 2.5% (adding 0.05 pp to CPI).
- Livestock Meat: Up 0.7% (adding 0.02 pp to CPI).
- Pork Prices: Notably up 3.1% (adding 0.04 pp to CPI). (Insight: Pork is a staple, and its price movement is always closely watched.)
- Fresh Vegetables: Significant drop! Down 8.3% (subtracting 0.17 pp from CPI).
- Egg Prices: Down 3.5% (subtracting 0.02 pp from CPI).
- Grain Prices: Down 1.4% (subtracting 0.02 pp from CPI).
Beyond food, the other seven major categories showed mixed results (6 ups, 1 down):
- Other Goods and Services: Major jump! Up 7.3%. (Insight: This broad category can sometimes reflect rising costs in less-tracked personal items or services.)
- Clothing: Up 1.5%.
- Education, Culture, and Entertainment: Up 0.9%.
- Medical Care: Up 0.3%.
- Housing: Up 0.1%.
- Household Goods and Services: Up 0.1%.
- Transportation and Communication: Notable decrease! Down 4.3%. (Insight: Often influenced by global energy prices and domestic travel policies.)
Find Top Talent on China's Leading Networks
- Post Across China's Job Sites from $299 / role
- Qualified Applicant Bundles
- One Central Candidate Hub
Your First Job Post Use Checkout Code 'Fresh20'

CPI Shifts: The Month-on-Month Story
Looking at the change from April to May 2025:
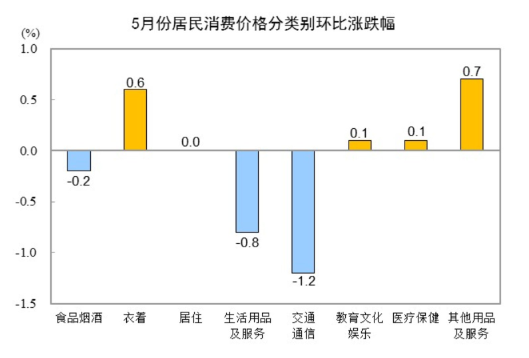
Food, Tobacco, and Alcohol prices decreased by 0.2% MoM, pulling the CPI down by about 0.05 percentage points.
Specifics within food:
- Fresh Vegetables: Down 5.9% (shaving 0.12 pp off CPI). (Insight: Seasonal availability plays a big role here.)
- Egg Prices: Down 0.9%.
- Livestock Meat: Down 0.2%.
- Pork Prices: Specifically fell 0.7%.
- Fresh Fruit: Up 3.3% (adding 0.07 pp to CPI).
- Aquatic Products: Up 0.8%.
For the other seven categories (MoM):
- Other Goods and Services: Up 0.7%.
- Clothing: Up 0.6%.
- Education, Culture, and Entertainment: Up 0.1%.
- Medical Care: Up 0.1%.
- Housing: Remained stable.
- Transportation and Communication: Down 1.2%. (Insight: Could be due to fluctuating fuel prices within the month.)
- Household Goods and Services: Down 0.8%.
ExpatInvest China
Grow Your RMB in China:
- Invest Your RMB Locally
- Buy & Sell Online in CN¥
- No Lock-In Periods
- English Service & Data
- Start with Only ¥1,000

Resume Captain
Your AI Career Toolkit:
- AI Resume Optimization
- Custom Cover Letters
- LinkedIn Profile Boost
- Interview Question Prep
- Salary Negotiation Agent
China’s Industrial Engine: Producer Price Index (PPI) Down 3.3% YoY in May 2025
Shifting gears to the industrial side, the Producer Price Index (PPI) for May 2025 signals continued deflationary pressure at the factory gate, decreasing by 3.3% year-on-year.
Month-on-month, the PPI fell by 0.4%.
The Purchasing Price Index for Industrial Producers also dropped, down by 3.6% YoY and 0.6% MoM.
From January to May, both the PPI and the Industrial Producer Purchasing Price Index averaged a 2.6% decrease compared to the same stretch last year. (Insight: Persistent negative PPI can indicate weaker industrial demand or overcapacity, impacting corporate profitability.)
PPI Breakdown: What’s Moving Factory Gate Prices? (Year-on-Year)
In May’s YoY PPI figures:
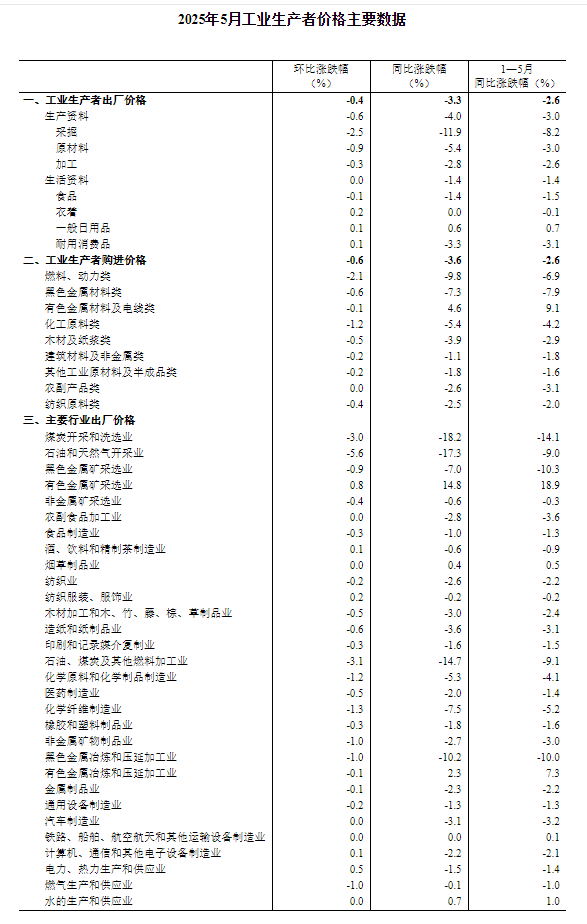
- Producer Goods Prices: Fell sharply by 4.0%. This heavily influenced the overall PPI, pulling it down by about 2.98 percentage points.
- Mining: Down a whopping 11.9%.
- Raw Materials Industry: Down 5.4%.
- Processing Industry: Down 2.8%.
- Consumer Goods Prices (at factory gate): Decreased by 1.4%, contributing a 0.36 percentage point drop to the overall PPI.
- Food: Down 1.4%.
- Clothing: Remained unchanged.
- Average Daily Necessities: Up 0.6%.
- Durable Consumer Goods: Down 3.3%. (Insight: Suggests manufacturers of durables are facing pricing pressure.)
For Purchasing Prices for Industrial Producers (YoY):
- Significant Drops:
- Fuels and Power: Down 9.8%.
- Ferrous Metals: Down 7.3%.
- Chemical Raw Materials: Down 5.4%.
- Moderate Drops:
- Agricultural Sideline Products: Down 2.6%.
- Textile Raw Materials: Down 2.5%.
- Construction Materials and Non-metallic Products: Down 1.1%.
- The Exception:
- Non-ferrous Metals and Wires: Up 4.6%. (Insight: This could be linked to specific global commodity trends or demand in sectors like EVs and renewables.)
PPI Shifts: The Month-on-Month Perspective
From April to May 2025, industrial producer prices saw these changes:
- Producer Goods Prices: Decreased by 0.6% MoM.
- Mining: Dropped 2.5%.
- Raw Materials Industry: Fell 0.9%.
- Processing Industry: Dipped 0.3%.
- Consumer Goods Prices (at factory gate): Remained unchanged MoM.
- Food: Down 0.1%.
- Clothing: Up 0.2%.
- Average Daily Necessities: Up 0.1%.
- Durable Consumer Goods: Up 0.1%.
For Purchasing Prices for Industrial Producers (MoM):
- Decreases:
- Fuels and Power: Down 2.1%.
- Chemical Raw Materials: Down 1.2%.
- Ferrous Metals: Down 0.6%.
- Textile Raw Materials: Down 0.4%.
- Construction Materials and Non-metallic Products: Down 0.2%.
- Non-ferrous Metals and Wires: Down 0.1%.
- Stable:
- Agricultural Sideline Products: Remained unchanged.
NBS Insights: What’s Driving These Price Movements in China?
The National Bureau of Statistics (NBS) shed some light on these figures, highlighting that while overall CPI was slightly down, the core CPI (excluding volatile food and energy prices) actually saw its year-on-year increase expand to 0.6%. This is up 0.1 percentage points from April, suggesting some underlying strength in consumer demand.
The NBS points to “stronger and more targeted measures implemented by China to boost consumption” and the accelerated growth of “new quality productive forces (xin zhiliang shengchanli 新质生产力)” as positive factors improving supply-demand dynamics in some areas.
CPI: Energy Prices Pull Down, But Consumer Demand Shows Bright Spots
MoM CPI Decline: Largely due to a 1.7% drop in energy prices (gasoline fell 3.8%). This alone accounted for nearly 70% of the total CPI decrease.
- Fresh vegetables dropped 5.9% due to increased supply.
- Fresh fruit, freshwater fish, and saltwater fish prices rose (3.3%, 3.1%, 1.5% respectively) due to weather and fishing season impacts.
Consumer Demand & Services: Holiday and cultural activities boosted hotel accommodation (up 4.6% MoM, highest in nearly a decade for this period!) and tourism (up 0.8% MoM). New summer apparel saw prices rise 0.6%.
- Core CPI (ex-food/energy): Up 0.6%, expanding from April.
- Industrial consumer goods (ex-energy): Prices rose 0.6% YoY.
- Gold jewelry: Up 40.1% YoY.
- Household textiles, Recreational durables: Prices also rose YoY.
- Vehicle prices (gas vs. new energy): Continued to fall YoY, but decreases narrowed.
- Service prices: Up 0.5% YoY, with transportation rental fees, airline tickets, and tourism shifting from falling to rising.
PPI: Still Low, But Marginal Improvements Emerge
The NBS attributes the MoM PPI decrease to:
- International Factors: Falling global crude oil prices impacting domestic petroleum industries (Extraction down 5.6%, Refined down 3.5% MoM).
- Domestic Energy/Raw Material Softness: Coal mining down 3.0% (off-season/stocks), Ferrous metal smelting down 1.0%, Non-metallic mineral products down 1.0% (construction slowdown/ample supply).
Despite the YoY PPI decline expanding (due to a high comparison base), the NBS sees marginal improvements:
- Consumer Goods (Factory Gate): Prices stabilized MoM, YoY decrease narrowed. Arts/crafts manufacturing (+12.8% YoY), footwear (+0.8% YoY) saw increases.
- High-End Equipment Manufacturing: Driving price increases for specific products (Integrated circuit packaging/testing +3.6% YoY, Aircraft manufacturing +3.6% YoY, Wearable smart devices +3.0% YoY).
- New Energy Industries: Supply-demand improved, YoY price declines narrowed (Photovoltaic equipment down 12.1% YoY, Lithium-ion batteries down 5.0% YoY).
This nuanced picture suggests that while headline numbers show deflationary pressures, specific government policies and sectoral strengths are creating pockets of price resilience and even growth.

Key Definitions for Context
What is the Consumer Price Index (CPI)?
The Consumer Price Index (CPI) is your go-to for understanding how much prices are changing for the stuff everyday people buy.
It tracks a basket of goods and services including:
- Food, tobacco, and alcohol
- Clothing
- Housing
- Household goods and services
- Transportation and communication
- Education, culture, and entertainment
- Medical care
- Other goods and services
Data is gathered from around 100,000 price points across ~500 cities/counties, including e-commerce.
What are Industrial Producer Price Indices (PPI)?
This covers two main things:
- Producer Price Index for Industrial Products (PPI): This shows changes in prices that industrial companies get when they first sell their products (ex-factory prices).
- Purchasing Price Index for Industrial Producers: This tracks price changes for raw materials and intermediate goods that industrial companies buy to make their products.
PPI stats cover 40 major industrial sectors and over 1300 products, based on surveys from over 40,000 enterprises.
Data Note: Due to rounding, sometimes summed data might look a bit off from individual components. Tiny price changes might be reported as ‘stable’ if they round to 0.0%.
Wrapping Up: Navigating China’s Economic Data
May 2025’s China economic data paints a complex picture: mild consumer price deflation overall, but with a resilient core CPI and service sector.
Meanwhile, producer prices remain under significant pressure, though targeted industrial policies and specific high-tech/new energy sectors are showing signs of improvement.
For investors, founders, and marketers, these trends in
China’s May 2025 CPI and PPI are crucial for strategic planning and understanding the evolving Asian market dynamics.